Investing In LEGO: Gold Rush or Fool’s Gold?
/Best of BrickNerd - Article originally published December 1, 2022.
Sometimes Nerdvember just isn’t long enough for all the incredible deep dives we have planned for you here at BrickNerd, so today and tomorrow we are happy to present a short series on LEGO investing where we will try to quantitatively answer the perennial question, “Is LEGO a better investment than gold?”

1. Introduction
Stocks, Bonds, Gold, Art… & LEGO?
In December 2021, the Guardian Newspaper in the UK published an article with the headline ‘Investing in LEGO may be ‘more lucrative than gold’. It reported on the work of Victoria Dobrynskaya, an associate professor at the Faculty of Economic Sciences at HSE. The research concluded that the annual return from investing in LEGO was 11% per year (8% in real terms) based on a sample of 2,322 LEGO sets over the period of 1987 to 2015.

Image by 9_fingers_, via Envato Elements
This is an impressive return, and according to the research, it is a ‘faster and better rate of return than gold, stocks, bonds, stamps, and wine’. But before you sell your Tesla shares, cash out your hoard of gold bars, or ditch (perhaps drink?) your collection of fine vintage wines to reinvest in LEGO, let’s have a closer look at what’s really going on.
Priors
‘LEGO Investing’ is the practice of buying new LEGO sets and selling them after they retire a few years later, with the expectation that prices on the aftermarket will rise above the initial purchase price.
Before we begin, I want to declare my position so you can judge any biases I may have on the subject. I have personally never bought a LEGO set for the purpose of selling it for a profit. That means I am not experienced with the operational aspects of being a successful, or more likely in my case, unsuccessful LEGO investor. Therefore, this is purely a desktop review. I’m not at all opposed to the practice and would say I’m generally agnostic. I have bought a couple of retired sets in the past, so I guess the opportunity to purchase unavailable sets on BrickLink or eBay fills a genuine need for the LEGO community.
What I’d like to achieve here is to perform an unbiased analysis of the returns made from LEGO investing aimed at informing a wider audience of LEGO enthusiasts.
2. The Retiring Sets Sample (2005 to 2021)
Sample Size
The sample I chose to analyze consists of every LEGO set with 500 pieces or more that retired between 2005 and 2021 (sourced from Brickset). I then obtained the average selling price for new sets from BrickLink, covering all sales over a 6-month period to September 2022. There are some pros and cons of using BrickLink price data. The main con is, anecdotally from watching YouTube videos about investing, that selling on eBay or Amazon can deliver a higher selling price.
It would be interesting to hear from any LEGO investors that sell across multiple platforms and can give an indication of the sales splits and any difference in returns. But for now, BrickLink benefits from a very large sample size of sales. It also lists sales quantities, meaning we can make some useful estimations of supply and demand, which is not possible on other platforms.
In total, there were 911 LEGO sets retiring between 2005 and 2021 (with 500 pieces or more), with just 19 retiring sets in 2005 rising to 98 retiring sets in 2021. 85 sets were excluded due to insufficient sales data giving us a total sample size of 836 sets.
Sterling Performance
The following figures are stated in Pound Sterling (sorry!). However, Sterling it is not too far from parity with the US Dollar and Euro, so the comparison shouldn’t be too difficult and it’s the percentage return we will focus on.

From our 826-set sample, 16,200 units were sold on BrickLink in 6 months generating £2.7m in revenue. On average, sets sold for 54% more than their original retail price.
Initially, that looks pretty good. An average return of 54% across such a large sample shows consistency in the price increases after retirement. However, 54% represents the total return and doesn’t differentiate when the sets were purchased. The sale could have been:
A 2005 set where a 54% return over 17 years is ‘not great’
A 2014 set where a 54% return over 8 years is ‘not great, not terrible’
A 2021 set where a 54% return over 1 year is ‘absolutely superb’
We’ll adjust for this time aspect and calculate an annualised return below.
Secondary Market Size
Even though our sample does not include Amazon sales, eBay sales, or sales of smaller sets, it is still useful to compare it to the overall market for LEGO products. The LEGO Group recorded a turnover of kr55.2 billion in 2021, which converts to £6.2bn (at September 2022 exchange rates when these calculations were performed). The annual market size for our sample is (£2.7m x 2) = £5.5m, representing just 0.08% of The LEGO Group’s turnover, essentially a rounding error.
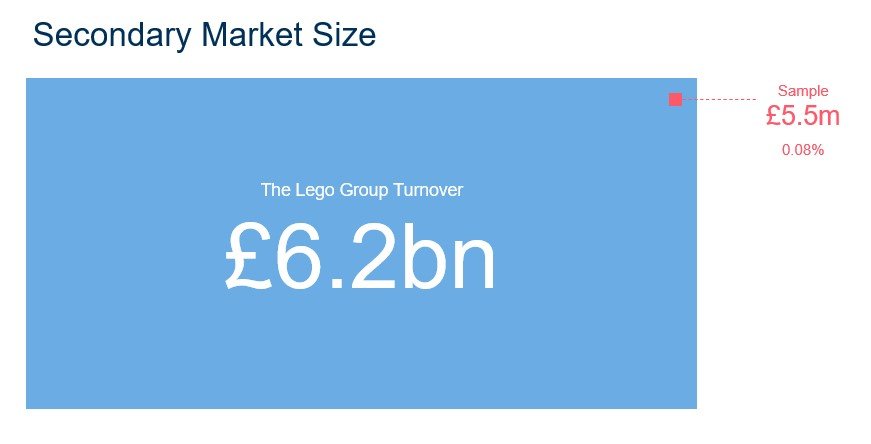
Admittedly, our sample is incomplete, but even if we assumed it was four times larger, it would still represent just 0.3%. In addition, the total LEGO market size is larger than The LEGO Group’s turnover as it doesn’t account for the margin made by other retailers selling LEGO products such as Amazon, Walmart and the rest.
£5.5m is worldwide sales, and most LEGO investors will be constrained to re-selling their sets in their own country or region. If the sales profile of the secondary market matches the sales profile of The LEGO Group, our £5.5m sample would be split:
£2.2m (42%) – Europe, Middle East and Africa
£2.1m (40%) – The Americas
£0.8m (18%) – Asia & Pacific

Image by LightFieldStudios, via Envato Elements
What does all this mean? Compared to the mainstream investments mentioned above (gold, stocks, bonds, etc), the secondary market is extremely niche. There won’t be any hedge funds looking to diversify into retired LEGO sets any time soon because it simply can’t scale.
I know from watching online videos on YouTube that there are some who can make a living selling LEGO full-time. Still, I assume they’ll be in the minority, and for most, investing will be more for the enjoyment of it—earning a bit of extra cash on the side to fund their hobby.
3. Return on Investment
Adjusting for Real World Conditions
Return on Investment (ROI) is a relatively simple measure used to compare the performance of different classes of investment, measured as an annual percentage increase (or decrease if you’re unlucky). To make our numbers more reflective of the returns made LEGO Investors in practice, I am going to make two adjustments.
Firstly, it is likely LEGO Investors will time their purchase to obtain a discount and have assumed an average 20% discount rate on the RRP obtained from Brickset. Secondly, I’ve assumed that 15% of the selling price will be deducted in the form of platform fees and other miscellaneous expenses.
At this stage, I’m not going to make any adjustments for the time committed or storage costs. But clearly, storage is a big issue and even if there isn’t an additional cost, there is the opportunity cost of not being able to use that space for other activities.
Return on Investment Results
For the 16,200 individual sets (units) sold on BrickLink in the 6 months to September 2022, the average annual return on investment was 11.7%.
These results are exceptionally strong, and it is difficult to deliver a consistent 11.7% ROI from traditional investments without taking on levels of risk most conservative investors would deem unacceptable. What’s most surprising is that the ROI remained remarkably consistent across all years (remembering the year is when the set retired, not when it was sold).
The distribution of units sold is also worth highlighting. 41% of sales came from sets that retired in 2020 and 2021, indicating a number of investors have sold quickly and locked in their returns within 12 to 24 months of the initial purchase. 11.7% is also in-line with the 11% published in Victoria Dobrynskaya’s study (which was no doubt more detailed and scientific than mine), so that gives additional validity to the results (phew, I’ll take that!).
Top Performers
The purpose of this article was not to look at individual sets, or give investment tips, but rather to conduct an unbiased review of ‘LEGO Investing’. However, given the wealth of information sat in my spreadsheet, I thought you may find it interesting to look at the Top 20 sets that retired in either 2020 or 2021. Did any of your recent purchases appear? (Click to expand.)
‘Lies, Damned Lies and Statistics’ (Benjamin Disraeli)
Before we compare the 11.7% return with other common investments, I want to highlight how easy it is for organisations to manipulate growth statistics if they so wish. It all comes down to choosing your starting point. The following example looks at the S&P 500 index between 2000 and 2022.
If I want to make the S&P 500 return look relatively weak, I would choose a starting point immediately before the 2008 Financial crisis and ensuing market collapse which would deliver an ROI of 6.0% per year. However, if it’s in my interest to make the S&P 500 look as strong as possible, I would pick a starting point just 18 months later which delivers growth of 13.4% per year over a 13.5-year period. Disraeli was onto something as the difference between the two is simply staggering.
This trick is used regularly in news media, corporate reporting, and politics. Just keep an eye out the next time you see a trend graph or growth rate on the news. To try and eliminate this bias here, I’ve chosen 1 September 2004 as my starting point, mid-way between the early 2000’s recession and the 2008 Financial Crisis, giving us a decent period of 18 years.
Junk Bond Trader
Let me say right off the bat, I do not like this graph. It’s not that the information is incorrect or has been manipulated to show a biased position. It hasn’t—the numbers are spot on. I don’t like it because it gives LEGO Investing a ‘false equivalency’. When we put it together with the other investments, we’re effectively saying they are comparable (because we’re comparing them!), but clearly there’s virtually no comparison to be had.
Not only is the market for retired sets minuscule in relative terms, but LEGO investing requires both time and space, which come at a cost. The others require just a click of a button and your ownership is stored on the server of some financial institution—not in your basement or spare room (unless you’ve got a few gold bars tucked away under your floorboards).

Image by Maciejbledowski, via Envato Elements
I also wouldn’t want someone uninitiated in ‘LEGO Investing’ to look at this and think I’m promoting it over the other investments. I’m definitely not. That said, I think this exercise still has merit. It has given us a high-level understanding of how LEGO investors are performing, and we have got to understand a bit about the market size.
For me personally, the numbers make me feel a little less guilty when spending money on a LEGO. If properly looked after, your money is kind of still there on your shelf, unlike a meal out, streaming subscription or holiday where once the money’s spent, it stays spent and you’re just left with memories (and sometimes a hangover).
Has this exercise persuaded me to become a LEGO Investor? Not really, I’m still agnostic. Yes, 11.7% is a very good return, but the time required, storage implications and hassle of dealing with returns and demanding customers isn’t for me—but equally, I can see how it absolutely could be for others. (I also don’t have the self-discipline to NOT build any sets in storage. It would just take one moment of weakness—and 24 months is a long time to suppress all those many moments of weakness.)
Next Time
I’ve really enjoyed pulling this together and if you’re still reading, I can only commend you for making it this far, and hope you’ve found something of interest. But this analysis isn’t over, we are going to need a Part 2, coming very soon. Despite the large sample size covering over 800 sets, there is still an underlying bias in the sample that simply cannot be removed.
The sample may be excellent at measuring the returns of sets that were sold, but unfortunately, it gives no attention whatsoever to the sets that do not sell. For example, despite a healthy 9.5% return for sets retiring in 2021, two-thirds of these sets (67 out of 96) are currently selling at a loss. And when you dig a little deeper, it’s clear that there is a large oversupply issue.

Image by rawf8, via Envato Elements
In Part 2, I will ‘kick the tyres’ on the returns in this article and try to get a better understanding of the fragility not immediately obvious in the analysis provided here. I’ll also introduce ‘Inventory Turnover’, a metric that I think both LEGO investors and BrickLink parts sellers will find useful, and show how it can be easily calculated using data from BrickLink.
So don’t drink that 1981 vintage Sauvignon Blanc just yet— LEGO might not be as good an investment as it seems…
Do you purchase LEGO sets as investments? Let us know in the comments below!
Do you want to help BrickNerd continue publishing articles like this one? Become a top patron like Charlie Stephens, Marc & Liz Puleo, Paige Mueller, Rob Klingberg from Brickstuff, John & Joshua Hanlon from Beyond the Brick, Megan Lum, Andy Price, Lukas Kurth from StoneWars, Wayne Tyler, Monica Innis, Dan Church, and Roxanne Baxter to show your support, get early access, exclusive swag and more.