Investing in LEGO, Part 2: Left on the Shelf
/BrickNerd is happy to present the second article in a short series on LEGO investing where we will analyze if holding onto LEGO sets for the long-term is a sound strategy to generate a profit.
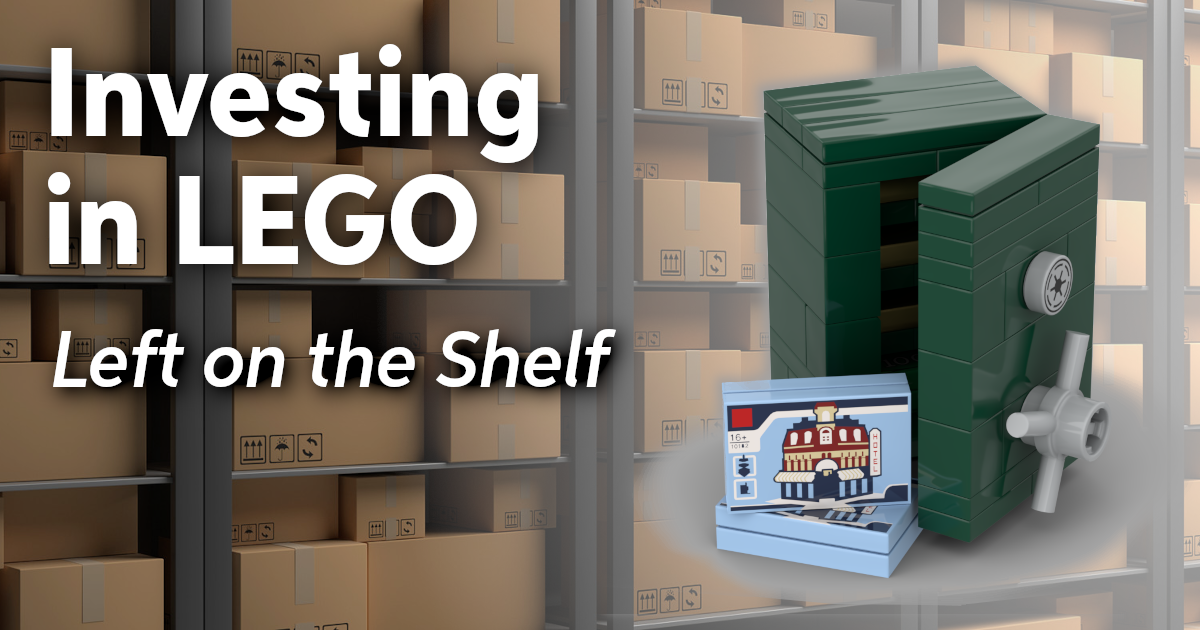
Safe build by Tom Gion and boxes by RAWF8, VIA ENVATO ELEMENTS
Previously On BrickNerd…
In Part 1 of this investment series, I conducted a review of the returns made from LEGO Investing by looking at the price increases of all sets retiring between 2005 and 2021 with 500 pieces or more. The annual return on investment from a sample of 826 sets was a healthy 11.7%, in line with an 11% return published in an academic study by Victoria Dobrynskaya.

Image by rthanuthattaphong, via Envato Elements
However, despite this impressive return, the sample took into account sets that had been sold and didn’t pay attention to sets that were listed for sale. When analysing the items currently listed for sale on BrickLink, there were some areas for concern. In Part 2, we will shed some light on these issues, answering the question, “What’s left on the shelf?”
4. Inventory Turnover
More than Just Profit
“Return on Investment” (ROI) and “Part Out Value” (POV) are both profitability metrics used by LEGO Investors and BrickLink sellers respectively. However, neither of these takes into account the length of time it takes to realise that profit.
For that, we need to use Inventory Turnover (sometimes referred to as Stock Turnover). It is a measure of inventory efficiency, which sounds dull, but is extremely useful for businesses (and of course, LEGO sellers). It shows how long the inventory of an organisation sits in its warehouse or on its shelves until it is sold. It is straightforward to calculate and can be done with publicly available information.
Inventory Turnover in Corporations
From the numbers in their 2021 Annual Report, we can estimate that The LEGO Group’s inventory turnover was 76 days, or more broadly, 2½ months.
On average, it takes 2½ months from the moment raw materials are received in The LEGO Group’s factories to them being purchased in the form of a finished product by you and me in its stores (or delivered onwards to the warehouses of other LEGO retailers such as Amazon).

Image by krisprahl, via Envato Elements
Tesco, a large UK supermarket, has a much lower inventory turnover of just 15 days, but this is expected given they just buy and sell finished goods and are not manufacturing them like The LEGO Group. Whisky distilleries are at the other end of the spectrum and need to measure inventory turnover in years. A 12-year-old Islay single malt is sat in its barrels for, well, 12 years before it is sold to its thirsty customers (me being one).
Just in Time
Companies are perpetually trying to minimise the amount of inventory they hold, and this comes back to the old accounting adage, “Turnover is vanity, profit is sanity, but cash is king!” If sales and profit remain constant, but the company can reduce its inventory holding through efficiencies by let’s say £100m, that £100m is converted directly into cash. They’ll also benefit from needing less warehouse space and associated cost savings. These efficiencies created a global “Just in Time” system and are reflected in reduced consumer prices.

Image by tampatra, via Envato Elements
But what has this got to do with LEGO Investing? It’s clear without performing any analysis that LEGO Investors are much more like whisky distillers than retailers or manufacturers. Inventory is sat for months, but more likely years before it is sold, and a profit is realised. Initially, that may not seem important, but when you take into account factors such as storage space, inflation, and cash being tied up for long periods of time, it is something that must be considered carefully.
5. BrickLink Supply and Demand
Inventory Turnover on BrickLink
BrickLink is one of the few places where you can calculate inventory turnover for every single type of item sold on the platform: every brick, plate, tile, minifigure, jumper, DUPLO brick, technic pin, sticker sheet and set. For example, 10264 Corner Garage retired in 2021 and is currently selling for £184 on BrickLink, +15% higher than its original retail price of £160.
173 units of 10264 Corner Garage were sold in a 6-month period, which translates to annual sales of 346 units per year (the demand). There are 688 units currently for sale on BrickLink (the supply), meaning it will take 2 years to sell all the sets listed.
That’s useful information. If you list Corner Garage on BrickLink today at the average price, you can expect to wait 2 years on average before you sell it. You may get lucky and sell it next month, but also may be unlucky and take 4 or 5 years to sell.
Inventory turnover becomes even more powerful when we use it to compare different products listed for sale.
The table above shows prices for four different colours of the 2x4 brick. Olive Green bricks are taking more than six times longer to sell than Light Bluish Grey bricks but are currently double the price. What gives?
In an efficient market, we would expect the price of the Olive Green brick to decrease quickly because the demand for it at that price is weak. However, it may take some time to fall given the mechanism used to set prices on BrickLink. The use of historic data to set prices creates a self-fulfilling cycle, slowing down the process of the price reflecting the natural supply and demand balance.
Herd Pricing
There is a whole other article waiting to be written on the topic of herd pricing, but for now, let’s just say BrickLink prices have some lagging effects, and inventory turnover can highlight these inefficiencies.
A brave BrickLink store owner might decide to completely re-price in line with inventory turnover (our supply-demand proxy). But in doing so, they might be exposed to customers just buying the parts where prices are reduced, ignoring the parts where prices are increased and choosing to buy those from other stores.
From the work done in this article, I’ve concluded at a very high level that:
Parts or sets taking more than 3 years to sell may be overpriced.
Parts or sets taking between 1 to 3 years to sell are probably priced about right.
Parts and sets selling in less than 1 year are ‘flying out the door’ and may be under-priced.
This isn’t a comprehensive piece of analysis but is a useful barometer for us here.
6. Cold Storage
It was 30 years ago today
Our sample from Part 1 identified 96 sets that retired in 2021, with an average ROI of +9.5%. However, two-thirds of those 96 sets are currently selling at a loss. Additionally, 43% of the sets had an inventory turnover of more than 5 years, and 27% of the sets had a turnover of more than 10 years!
An extreme example is 75254 AT-ST Raider which is currently selling 106 units a year on BrickLink (the demand), but there are 3,217 available for sale (the supply). It will take over 30 years to sell that inventory through, with the last of these sets selling sometime in the early 2050s. That is an absolute epoch! (This could be because there is an exclusive Star Wars figure in the set due to an actress leaving the production, but it seems many people had the same idea to put the set on shelves for a bit.)

image via brickset
Going 30 years in the other direction, at the start of the 1990s, 6086 Black Knight’s Castle was on the shelves of your local store along with vinyl and cassettes from Nirvana, Primal Scream, REM, Massive Attack, and most importantly of course, My Bloody Valentine. 30 years is a very long time.
75254 AT-ST Raider is not an isolated example. These are the 20 slowest-selling sets from the retiring class of 2021:
There are currently 15,612 units of these slow-selling sets available to purchase on BrickLink, but the annual demand is only 678, meaning it will take 23 years to sell all these items at the current rates.
Easy Way Out?
Looking at all the 2021 sets, we can start to see more fully the relationship between ROI and inventory turnover. The relationship isn’t perfect, as there isn’t a clear, straight line of best fit travelling from the top left of the graph to the bottom right in the image below.
What we can say though is that if a set is currently selling for a profit, it is also selling fast—investors holding sets in the Lime Dots Group above are in a good position. Their only decision is whether to cash out now or hold, hoping for further increases.
Secondly, we can say that if a set is selling slowly, it is almost certainly selling at a loss (with a couple of exceptions such as 21043 San Francisco). Investors holding sets in the Coral Dots Group are in for some big challenges as the supply is so much larger than demand.
Maybe parting out those sets is the best way to recoup the maximum amount from these sets rather than having them take up space on shelves, but this comes with its own issues, especially if the investor doesn’t already have a BrickLink parts store up and running.
The Bright Light Orange Dots Group is the ambiguous group that doesn’t quite fit the pattern. Its average inventory turnover of 2.3 years is closer to the profitable group (1.5 years), but its ROI of -11% is closer to the slow-selling group (-22%). Given the better balance of supply and demand here, the best strategy may be to hold for possible price increases in the future.
Inventory Turnover by Year Retired
The average inventory turnover for sets retiring in 2021 is a much more respectable 3.30 years, but it is still double the 1.64 year average for sets retiring between 2007 and 2019. Sets retiring in 2020 fair a little better at 2.40 years, but are still well above the historical average.
One interpretation of these numbers is that LEGO Investing has become more widespread in recent years, resulting in an increased supply and longer inventory turnover.
It’s not straightforward though and this may be the normal pattern for sets immediately after they retire. On balance, I would be concerned with these increased figures and would be monitoring closely the performance of the 2022 sets that are about to retire.
7. Future Returns
A Futurologist Walks into a Bar
Predicting the future is a fraught business. The number of times I’ve made definitive and hubristic claims about how things are going to play out, only to be left looking like a prize turnip in quite short order is, shall we say, not zero. But that doesn’t mean it isn’t fun to try, and if predictions are placed in the right context, with an understanding of how any supporting analysis has been conducted, they can be very useful and informative.

Image by andriymedvediuk, via Envato Elements
To better quantify the inventory turnover issues highlighted above and to help us understand how LEGO Investing may perform in the future, we need to create a comparison ROI for unsold sets. We’ve seen that the return for sets sold in our sample was 11.7%, let’s call this the ‘Historic ROI’.
Our new comparison metric, the ‘Future ROI’ is calculated in the same way, except rather than being weighted by sets sold, it is weighted by the sets available for sale on BrickLink. It effectively shows what the return on investment would be if all items listed on BrickLink were sold today at the average price selling price in the last 6 months.
Overall, the chart supports the issues highlighted in the inventory turnover section. If all sets listed for sale today were sold at the going rate, they would achieve a return on investment of 0%, break-even. Clearly this is very different from the 11.7% delivered from historic sales.
For sets retiring between 2007 and 2016, the differences between historic and future ROIs are marginal. However, they start to degrade from 2017 onwards, cumulating in 2021 where the historic ROI of +9% reduces to a future ROI of -10%. The overall future ROI of 0% is heavily influenced by the 2021 figure which accounts for almost half (47%) of the weighting. I can’t say with certainty that LEGO Investing is entering a downturn, but these results cannot be interpreted as being positive.
Yes, prices for most sets are likely to increase in the future, but we must remember ROI is an annualized figure. A set with an ROI of 10% needs to increase by another 10% in the next 12 months just to ‘stand still’ and stay at 10%.

Image by leungchopan, via Envato Elements
Again, I don’t want to draw any hard and fast conclusions, except to say these results, in conjunction with the inventory turnover figures, are at a minimum a warning sign that we are seeing a downturn in the returns achieved from LEGO Investing.
If this is the case, we can speculate what underlying reasons are driving the downturn. From a supply-side perspective, it may be that more people are investing in sets to sell on at a future date. The inventory turnover figures back this up to some extent. But also, from a demand side, the increase in the number and quality of sets produced by The LEGO Group may be taking up a higher proportion of our ‘LEGO spend’ than it used to. (Credit to our Nerd-in-Chief Dave who hypothesised this when we were planning this article.)
I think the only way to know for sure will be to repeat this exercise in 12 months, looking at any upwards movements in the 2017 to 2021 future ROI figures and seeing how the 2022 sets perform in their first-year post-retirement.
8. Conclusion
Six Takeaways
I’m very grateful for the opportunity to have written this article. It’s a fascinating topic, containing a wealth of interesting data, and I would be more than happy to chat about any of the points raised and take on board any constructive criticism.
But for now, I would say these are the six key takeaways for LEGO Investing:
From our sample of 826 sets retiring between 2005 and 2021 (with more than 500 pieces), the returns from LEGO Investing were a very healthy 11.7% per year, and these returns were consistent across sets from all years.
However, the size of the aftermarket is extremely small, making comparisons with shares, bonds, and other investments moot, especially given the amount of physical space and time required for LEGO Investing.
Inventory turnover is a useful metric to use on BrickLink—for both sellers of sets and parts. It can also be used as a proxy for supply and demand to uncover any inefficiencies in pricing on the platform.
Sets retiring in 2021 had an overall ROI of 9.5%, but two-thirds of those sets are currently selling at a loss due in part to a large oversupply. The inventory turnover for the worst-performing sets was more than 20 years.
The return on investment for sets currently available for sale on BrickLink is 0%, break-even (assuming all sets listed are sold today at the average price achieved in the last 6 months).
Finally, the disparity between the ‘Historic ROI’ of 11.7% and this ‘Future ROI’ of 0% has increased in the last five years, indicating that LEGO investing may be entering a downturn. Revisiting the analysis in 12 months will help us come to a more settled conclusion.
Final Thoughts
I cannot recommend highly enough a book by Jerry Z. Muller titled ‘The Tyranny of Metrics’. This may sound counterintuitive given the numerical content of this article, but his words expressed feelings I have had for some time when it comes to the use of data and Key Performance Indicators (KPIs).

Image by FoToArtist_1, via Envato Elements
The first is that a metric should only ever be used as one piece of evidence in forming a rounded assessment of a situation, or support for a decision. This is the case here with our two ROI metrics of 11.7% (historic) and 0% (future). Neither of these is necessarily the ‘right answer’, and even though at a high level they are both useful, they are just averages, not guarantees. If you are a LEGO Investor, there will be many other factors unique to you that impact your decision-making and ultimately, your success.
The second is that if you spend all your time focused on what you can measure, what important things are you ignoring that you can’t? This comes back to the personal enjoyment of LEGO Investing in tandem with other aspects of the hobby. I’ve performed the analysis and written this article as if it was a serious market review. And although interesting, I suspect that’s not really what LEGO investing is about for most.

Image by Christopher Clarke
You can’t measure the thrill of buying two copies of a set, one to build and another to hold, and then seeing it shoot up in value in the aftermarket, delivering a nice little profit to go and spend on more LEGO. You can’t measure the number of adult purchases justified with the thought “I can indulge in this set now because I can always sell it later.” You can’t measure the joy of LEGO fans whose primary expression of love for the hobby is collecting perfect, sealed boxes.
To that note, there’s just one last thing to say… enjoy what you do and happy investing!
Methodology
For those curious about the methods used in this series of articles, here are the considerations and calculations made to arrive at the conclusions above.
The ‘basic return is the difference between the average selling price of a retired set on BrickLink in the 6 months to September 2022, and the recommended retail price (RRP) listed on Brickset for a retired LEGO set.
An adjustment of 20% is applied to the RRP of each set to reflect the likelihood LEGO Investors time their purchases to receive a discount. A reduction of 15% applied to the average selling price to reflect platform fees and other miscellaneous selling costs.
No adjustments are made for time invested or storage space.
For each set, the adjusted basic return is then annualised to show the return generated each year. This allows sets retiring in different years to be compared directly with each other.
The annualized return on investment for each set is then weighted based on its total 6-month BrickLink sales (in sterling) to show an average ROI for each group of sets based on their year of retirement. It is then further aggregated based on the same weighting approach to give the 11.7% ROI quoted in this article. This is also sometimes referred to as ‘The Historic ROI’
The ‘Future ROI’ is calculated in the same way as the Historic ROI, except the weighting is based on the number of items listed for sale on BrickLink in September 2022, rather than the quantity of sales made in the previous 6 months.
Best of BrickNerd - Article originally published December 2, 2022.
Do you purchase LEGO sets as investments? Will you use these articles as references to justify your LEGO spending? Let us know in the comments below!
Do you want to help BrickNerd continue publishing articles like this one? Become a top patron like Charlie Stephens, Marc & Liz Puleo, Paige Mueller, Rob Klingberg from Brickstuff, John & Joshua Hanlon from Beyond the Brick, Megan Lum, Andy Price, Lukas Kurth from StoneWars, Wayne Tyler, Monica Innis, Dan Church, and Roxanne Baxter to show your support, get early access, exclusive swag and more.